TL;DR
- A concept B2B dashboard for fraud and risk teams to move from detection to decision at speed — triaging suspicious activity, investigating with evidence, and tracking where risk is concentrating.
- The hard part isn't detection — it's the handoff to a defensible decision: the queue is noisy, a risk score alone doesn't close a case, and context is scattered across transaction, user, device, and location.
- Built around one workflow — triage → queue → decision → entity context → trend validation — with the risk score as the first signal and structured evidence making it actionable.
The Challenge
Fraud monitoring breaks when teams can't reliably move from detection to decision at speed.
- The queue is noisy and constantly shifting. Analysts face a mix of edge cases, repeated attempts, and bursts of activity — the hardest part is finding what matters right now.
- A risk score ranks cases but doesn't close them. Decisions still need what triggered the score, what evidence supports it, and how confident the system is.
- Context is spread across objects. Investigations jump between transaction, user history, device/IP signals, and location patterns; split across views, that slows work and invites errors.
- Filtering is the primary investigation tool during spikes. Analysts narrow by risk factor, cross-border activity, time window, device/method, and amount — weak filters turn investigation into manual scanning.
- Ops teams need early signals, not just today's list. Leads need to see where risk concentrates and what's changing to tune rules and staffing before losses rise.
Detection was never the bottleneck — the move from signal to decision was.
The Solution
- Designed the product around one workflow. Triage → queue → decision → entity context → trend validation. Every screen has a job in that sequence rather than being a standalone view.
- Made the risk score the first signal, and evidence the follow-through. The score ranks cases fast; structured evidence — triggers, signal checks, an event timeline, and similar past cases — makes it actionable instead of something analysts have to trust blindly.
- Held the set together with shared rules. One risk scale (Low 0–30, Medium 31–50, High 51–90, Critical 90–100), one way of showing it (% for precision + bar for comparison), and a stable table grammar across all six screens so it reads as one system.
Key Decisions
-
Made urgent work the default view
- Problem
- Analysts waste time deciding what to open first.
- Decision
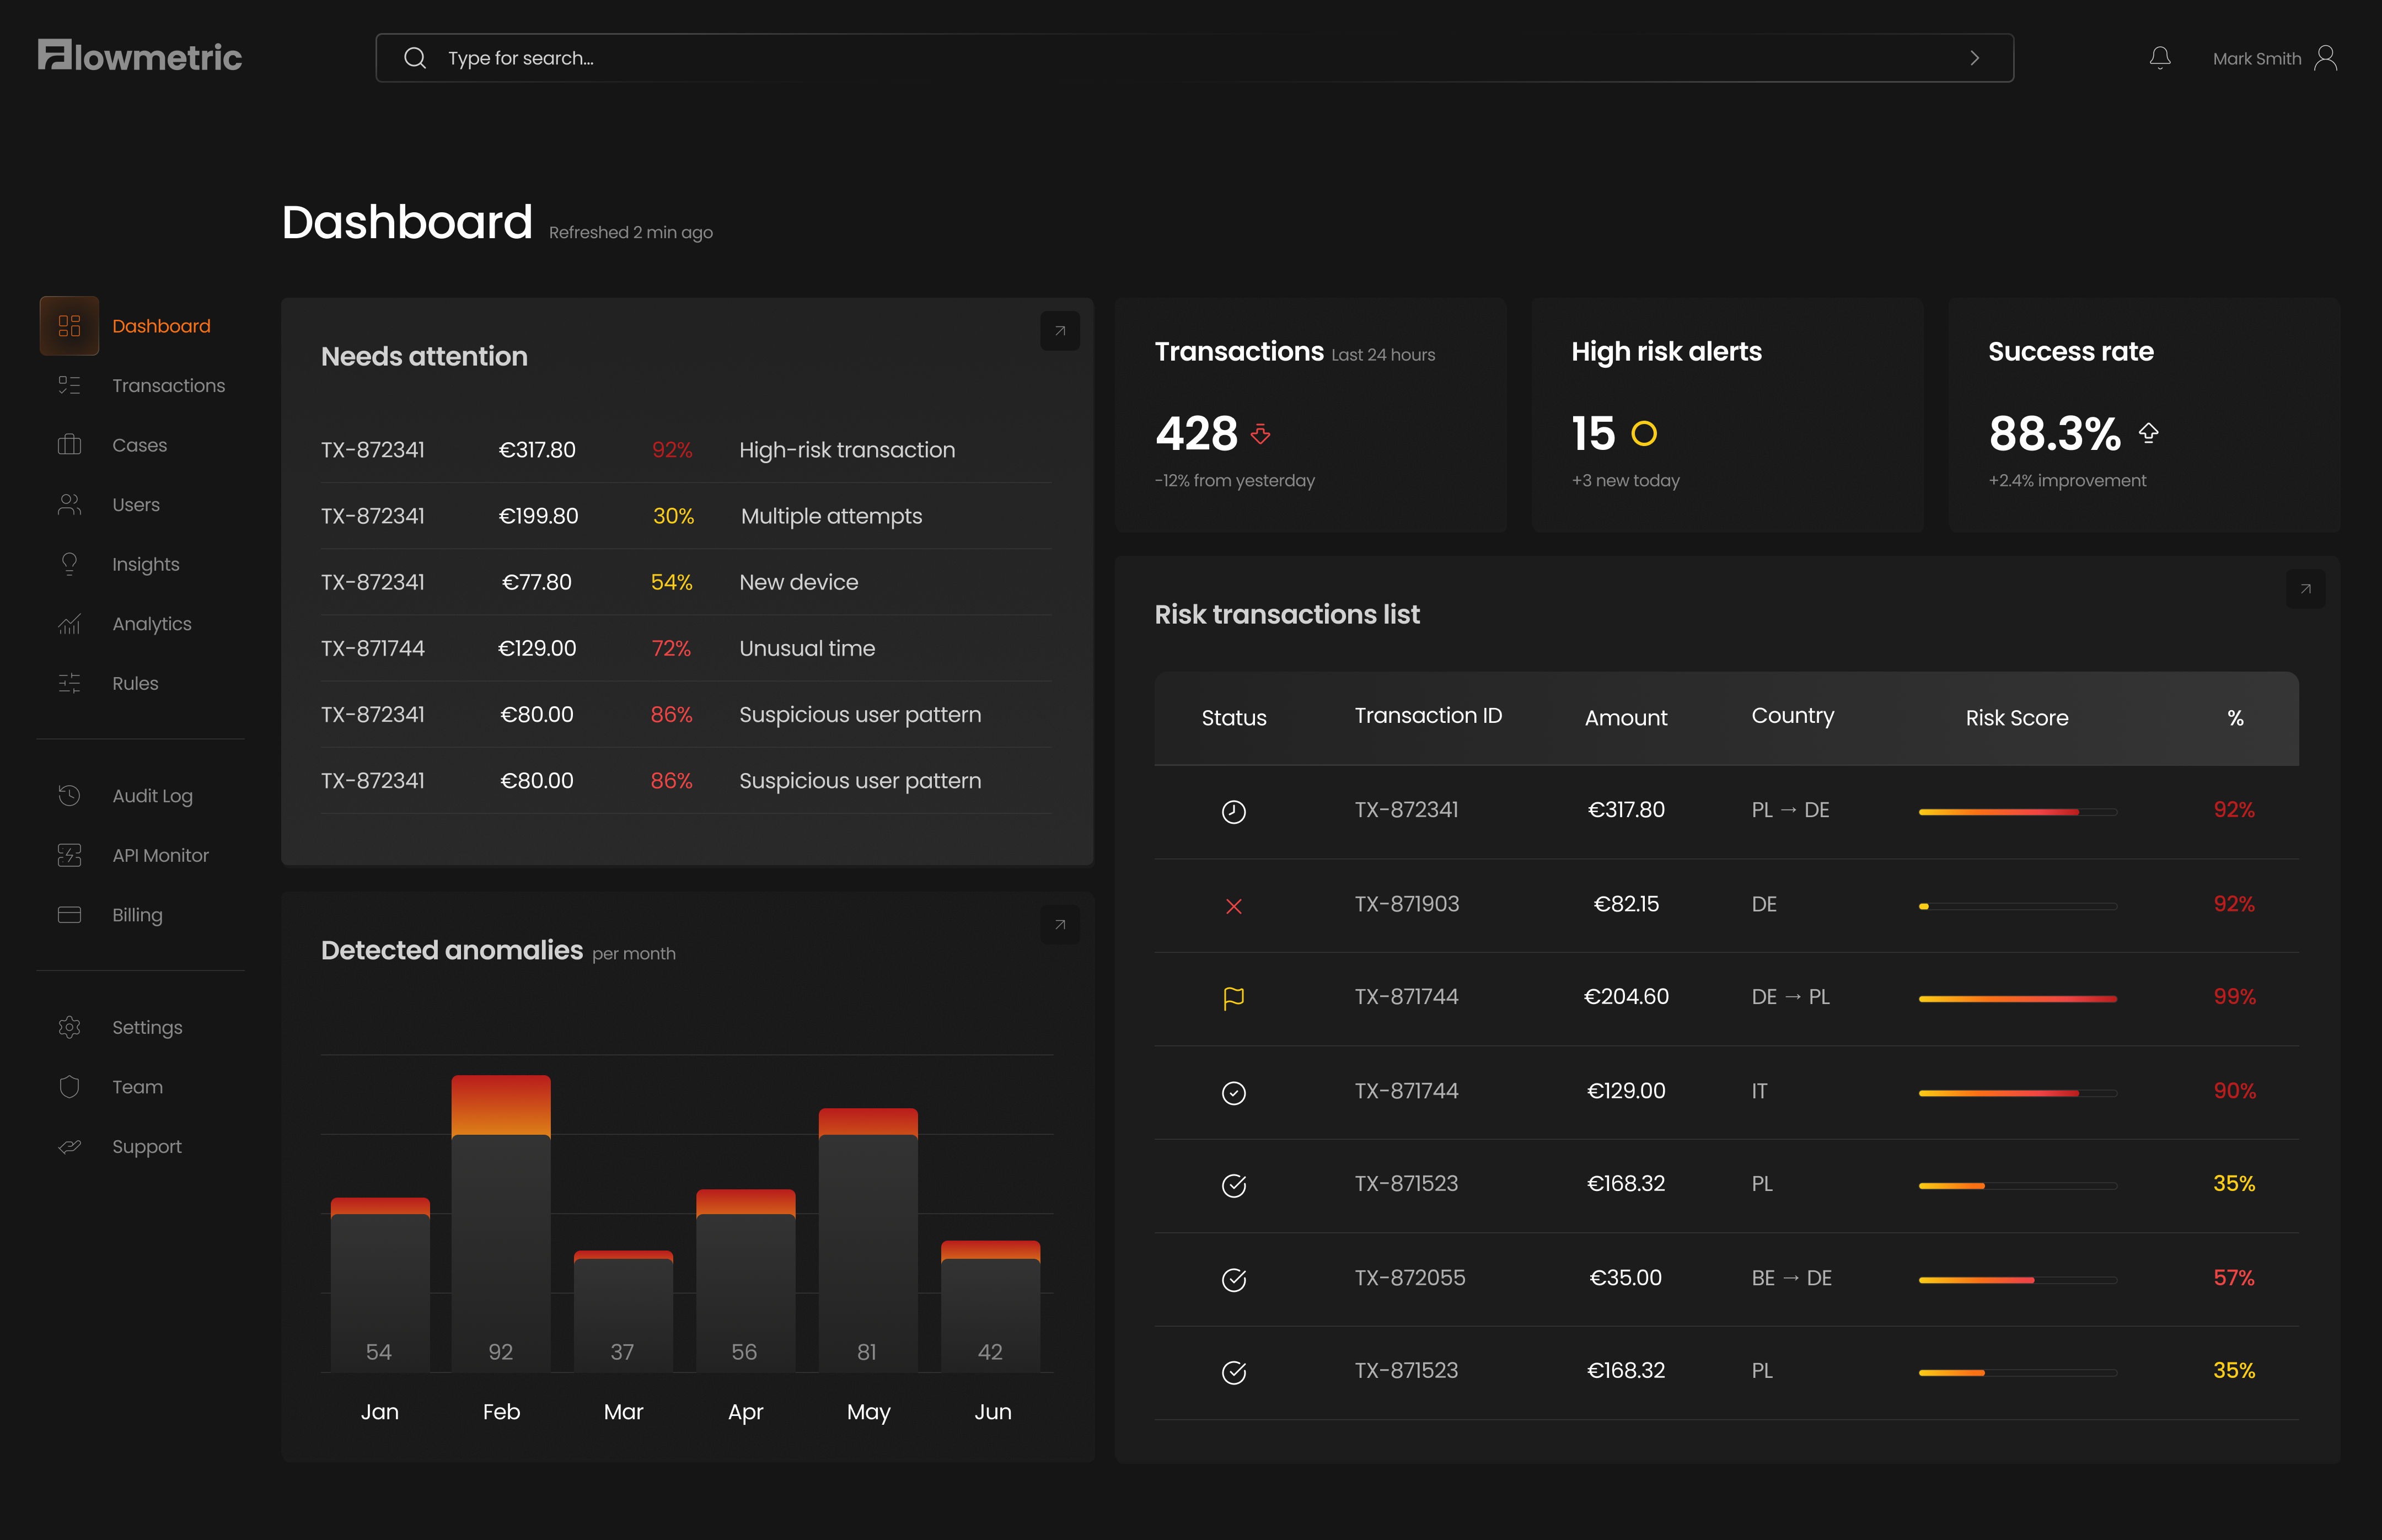
- Triage is the landing state: a “needs attention” queue comes first, backed by only the essential KPIs (volume, alerts, success rate) and a single anomaly chart to spot pressure changes.
- Where
- Dashboard
-
Optimized the queue for scan speed and ranking
- Problem
- Large tables get slow to read when the hierarchy is unclear.
- Decision
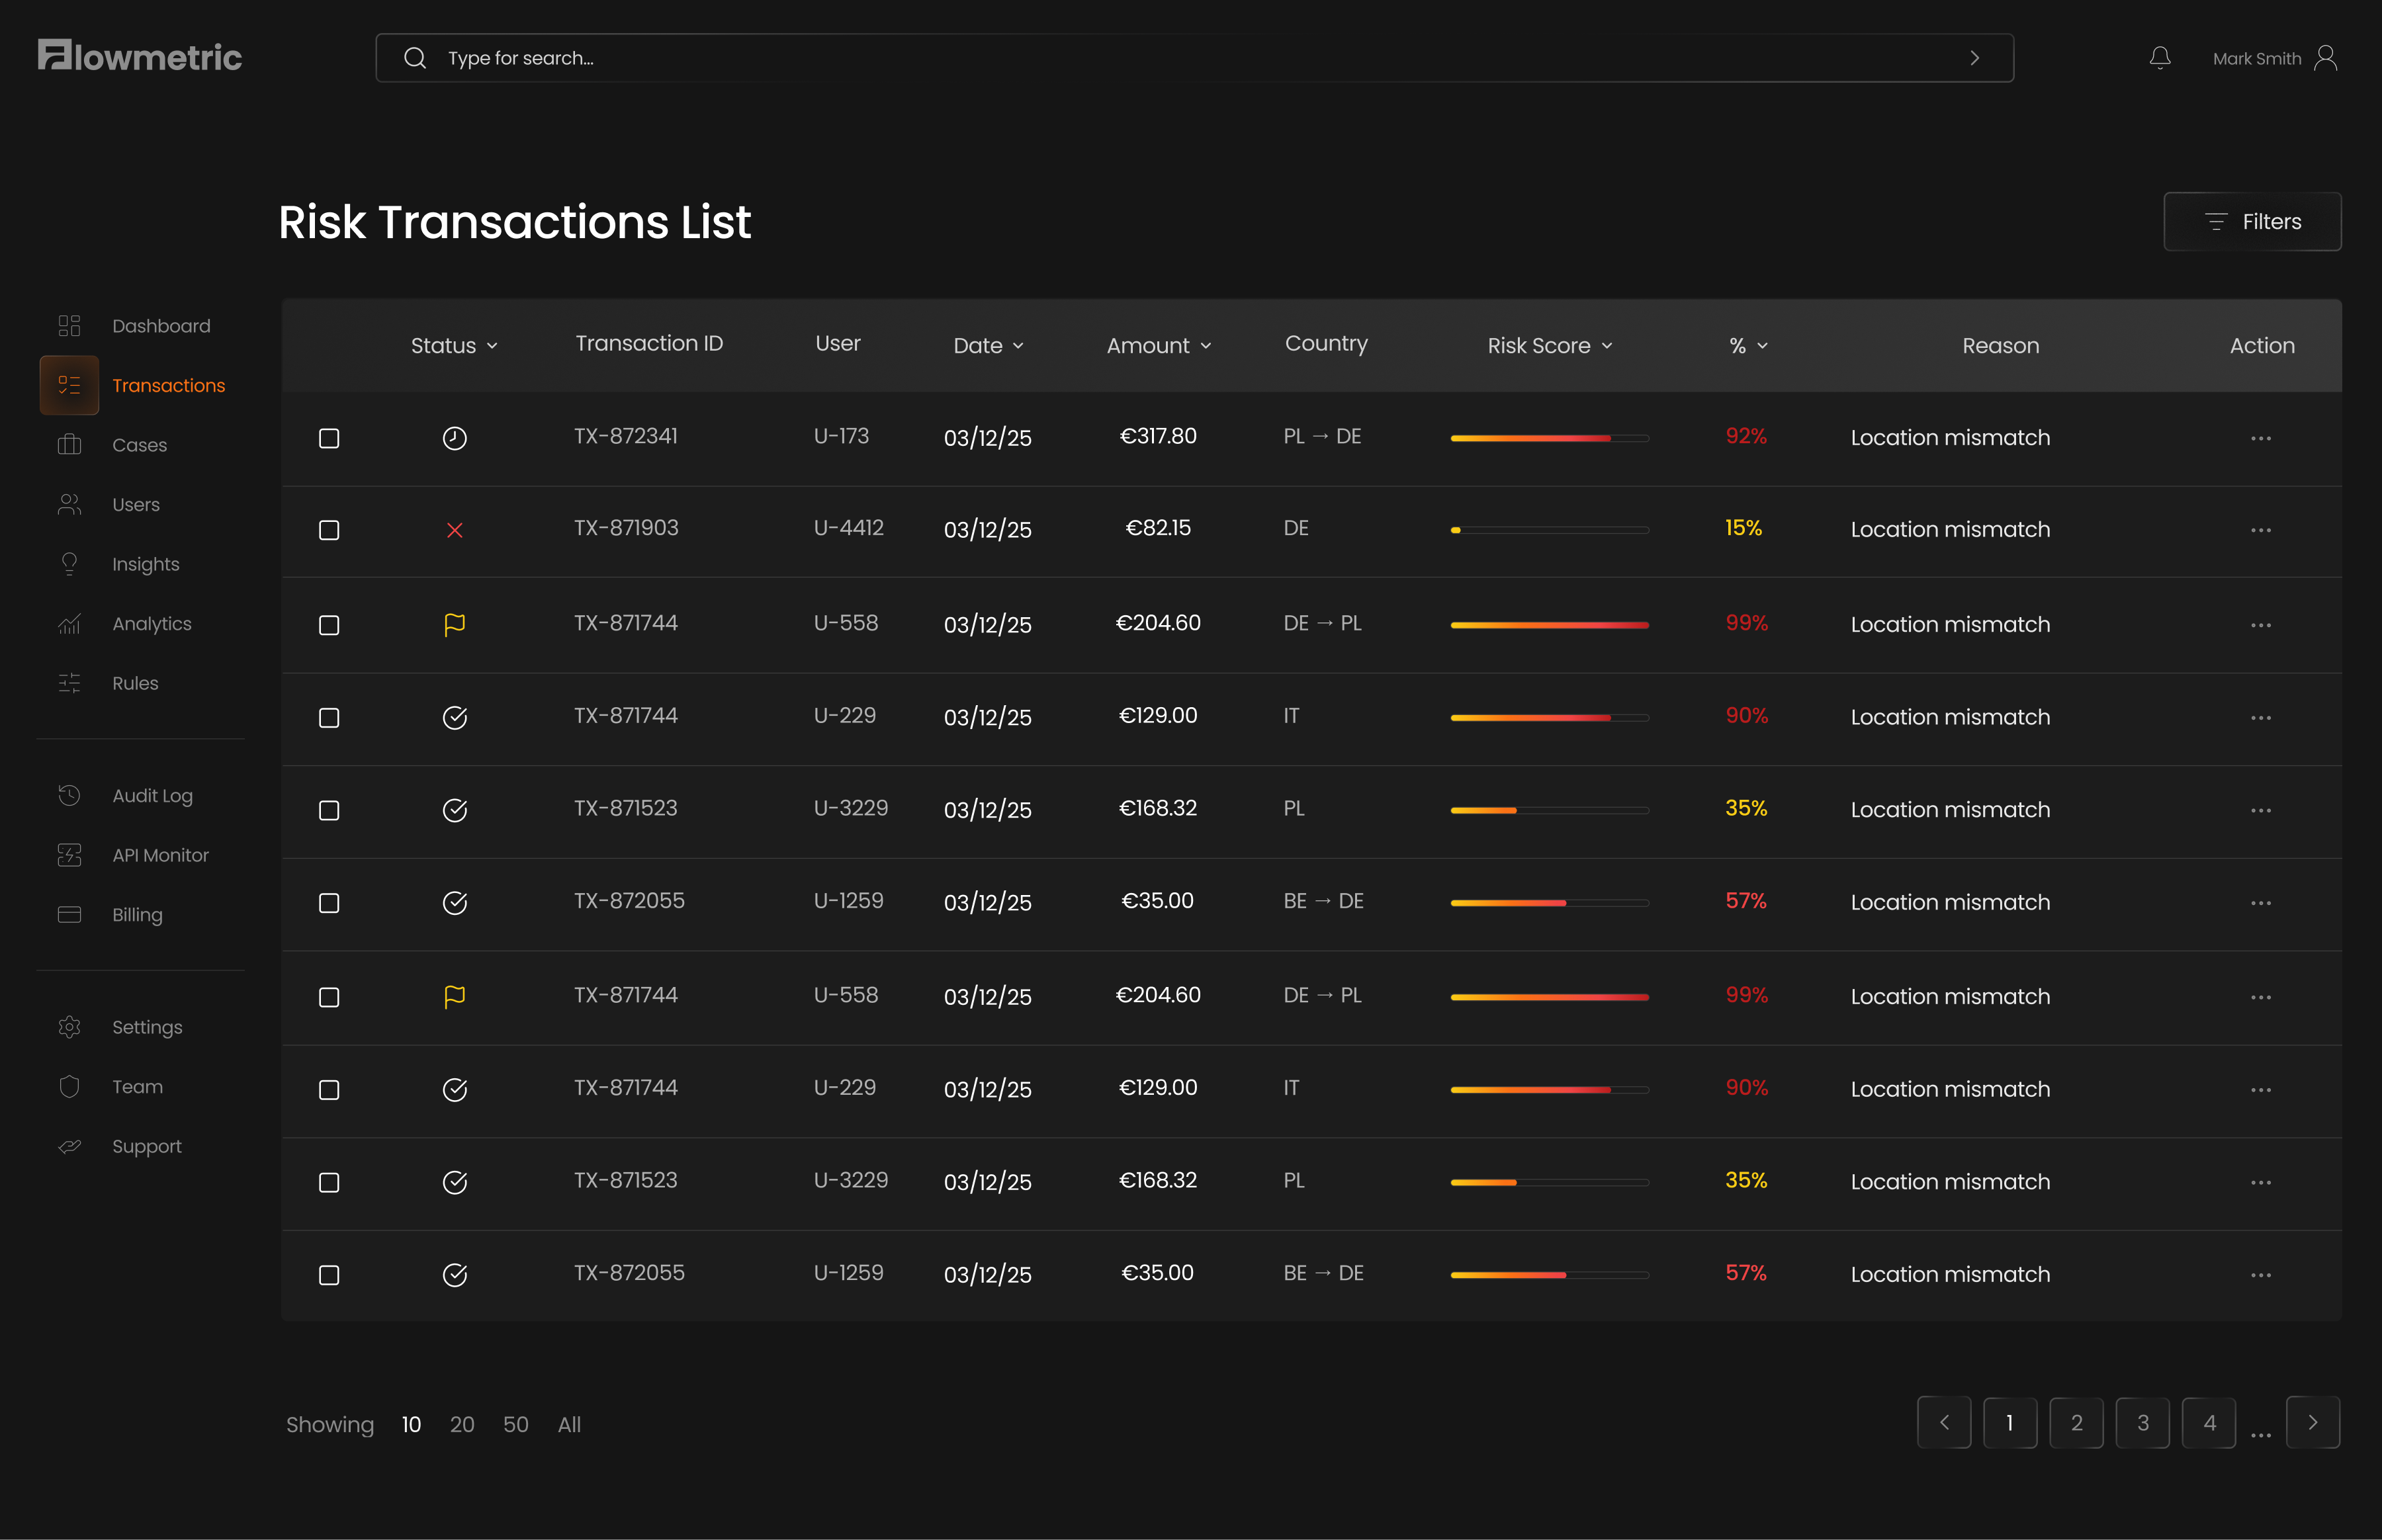
- A stable column order (status → ID → user → date → amount → country → risk), risk shown two ways (bar for comparison, % for precision), and the reason kept visible in-row to avoid extra clicks.
- Where
- Risk Transactions List
-
Built the detail view around “score first, proof next”
- Problem
- Analysts need to understand why a score is high, fast.
- Decision
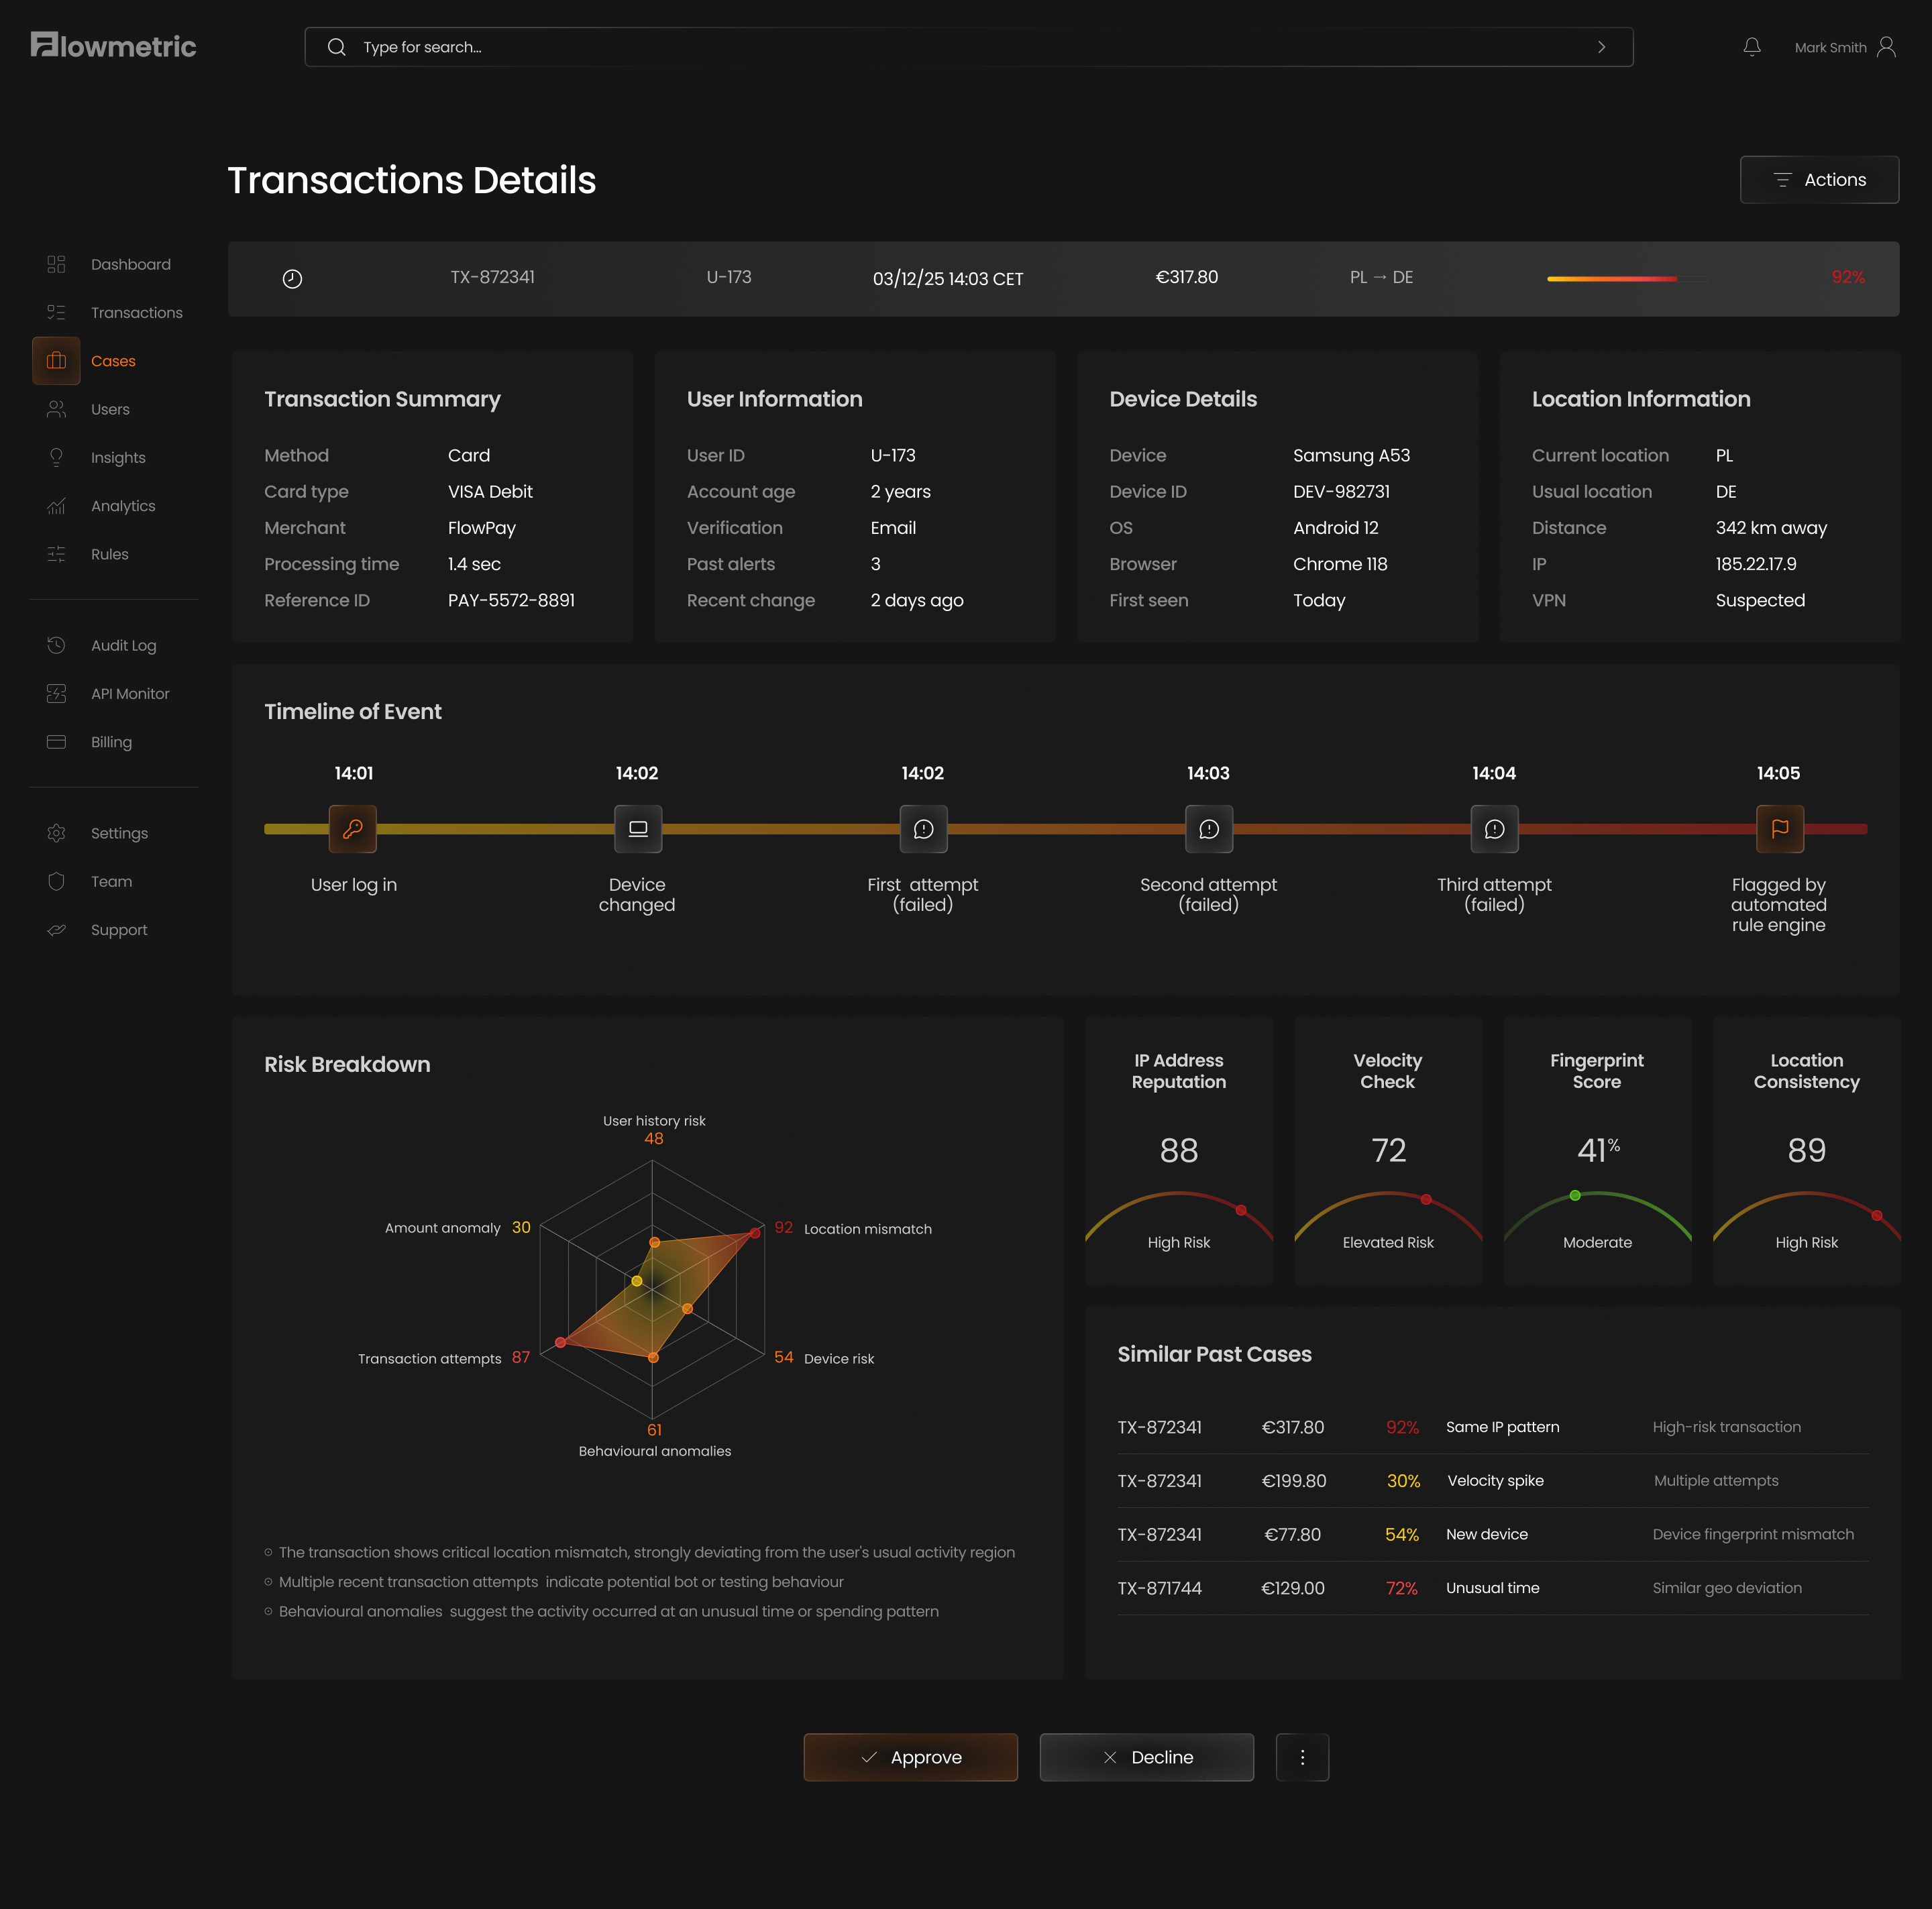
- The score stays prominent, then evidence follows in consistent blocks — summary context, an event timeline (login → device change → attempts → flag), a risk-driver breakdown, signal checks (IP, velocity, fingerprint, location), and similar past cases — ending in clear approve/decline actions.
- Where
- Transaction Details
-
Matched filters to how analysts actually slice cases
- Problem
- During spikes, narrowing the dataset is the job.
- Decision
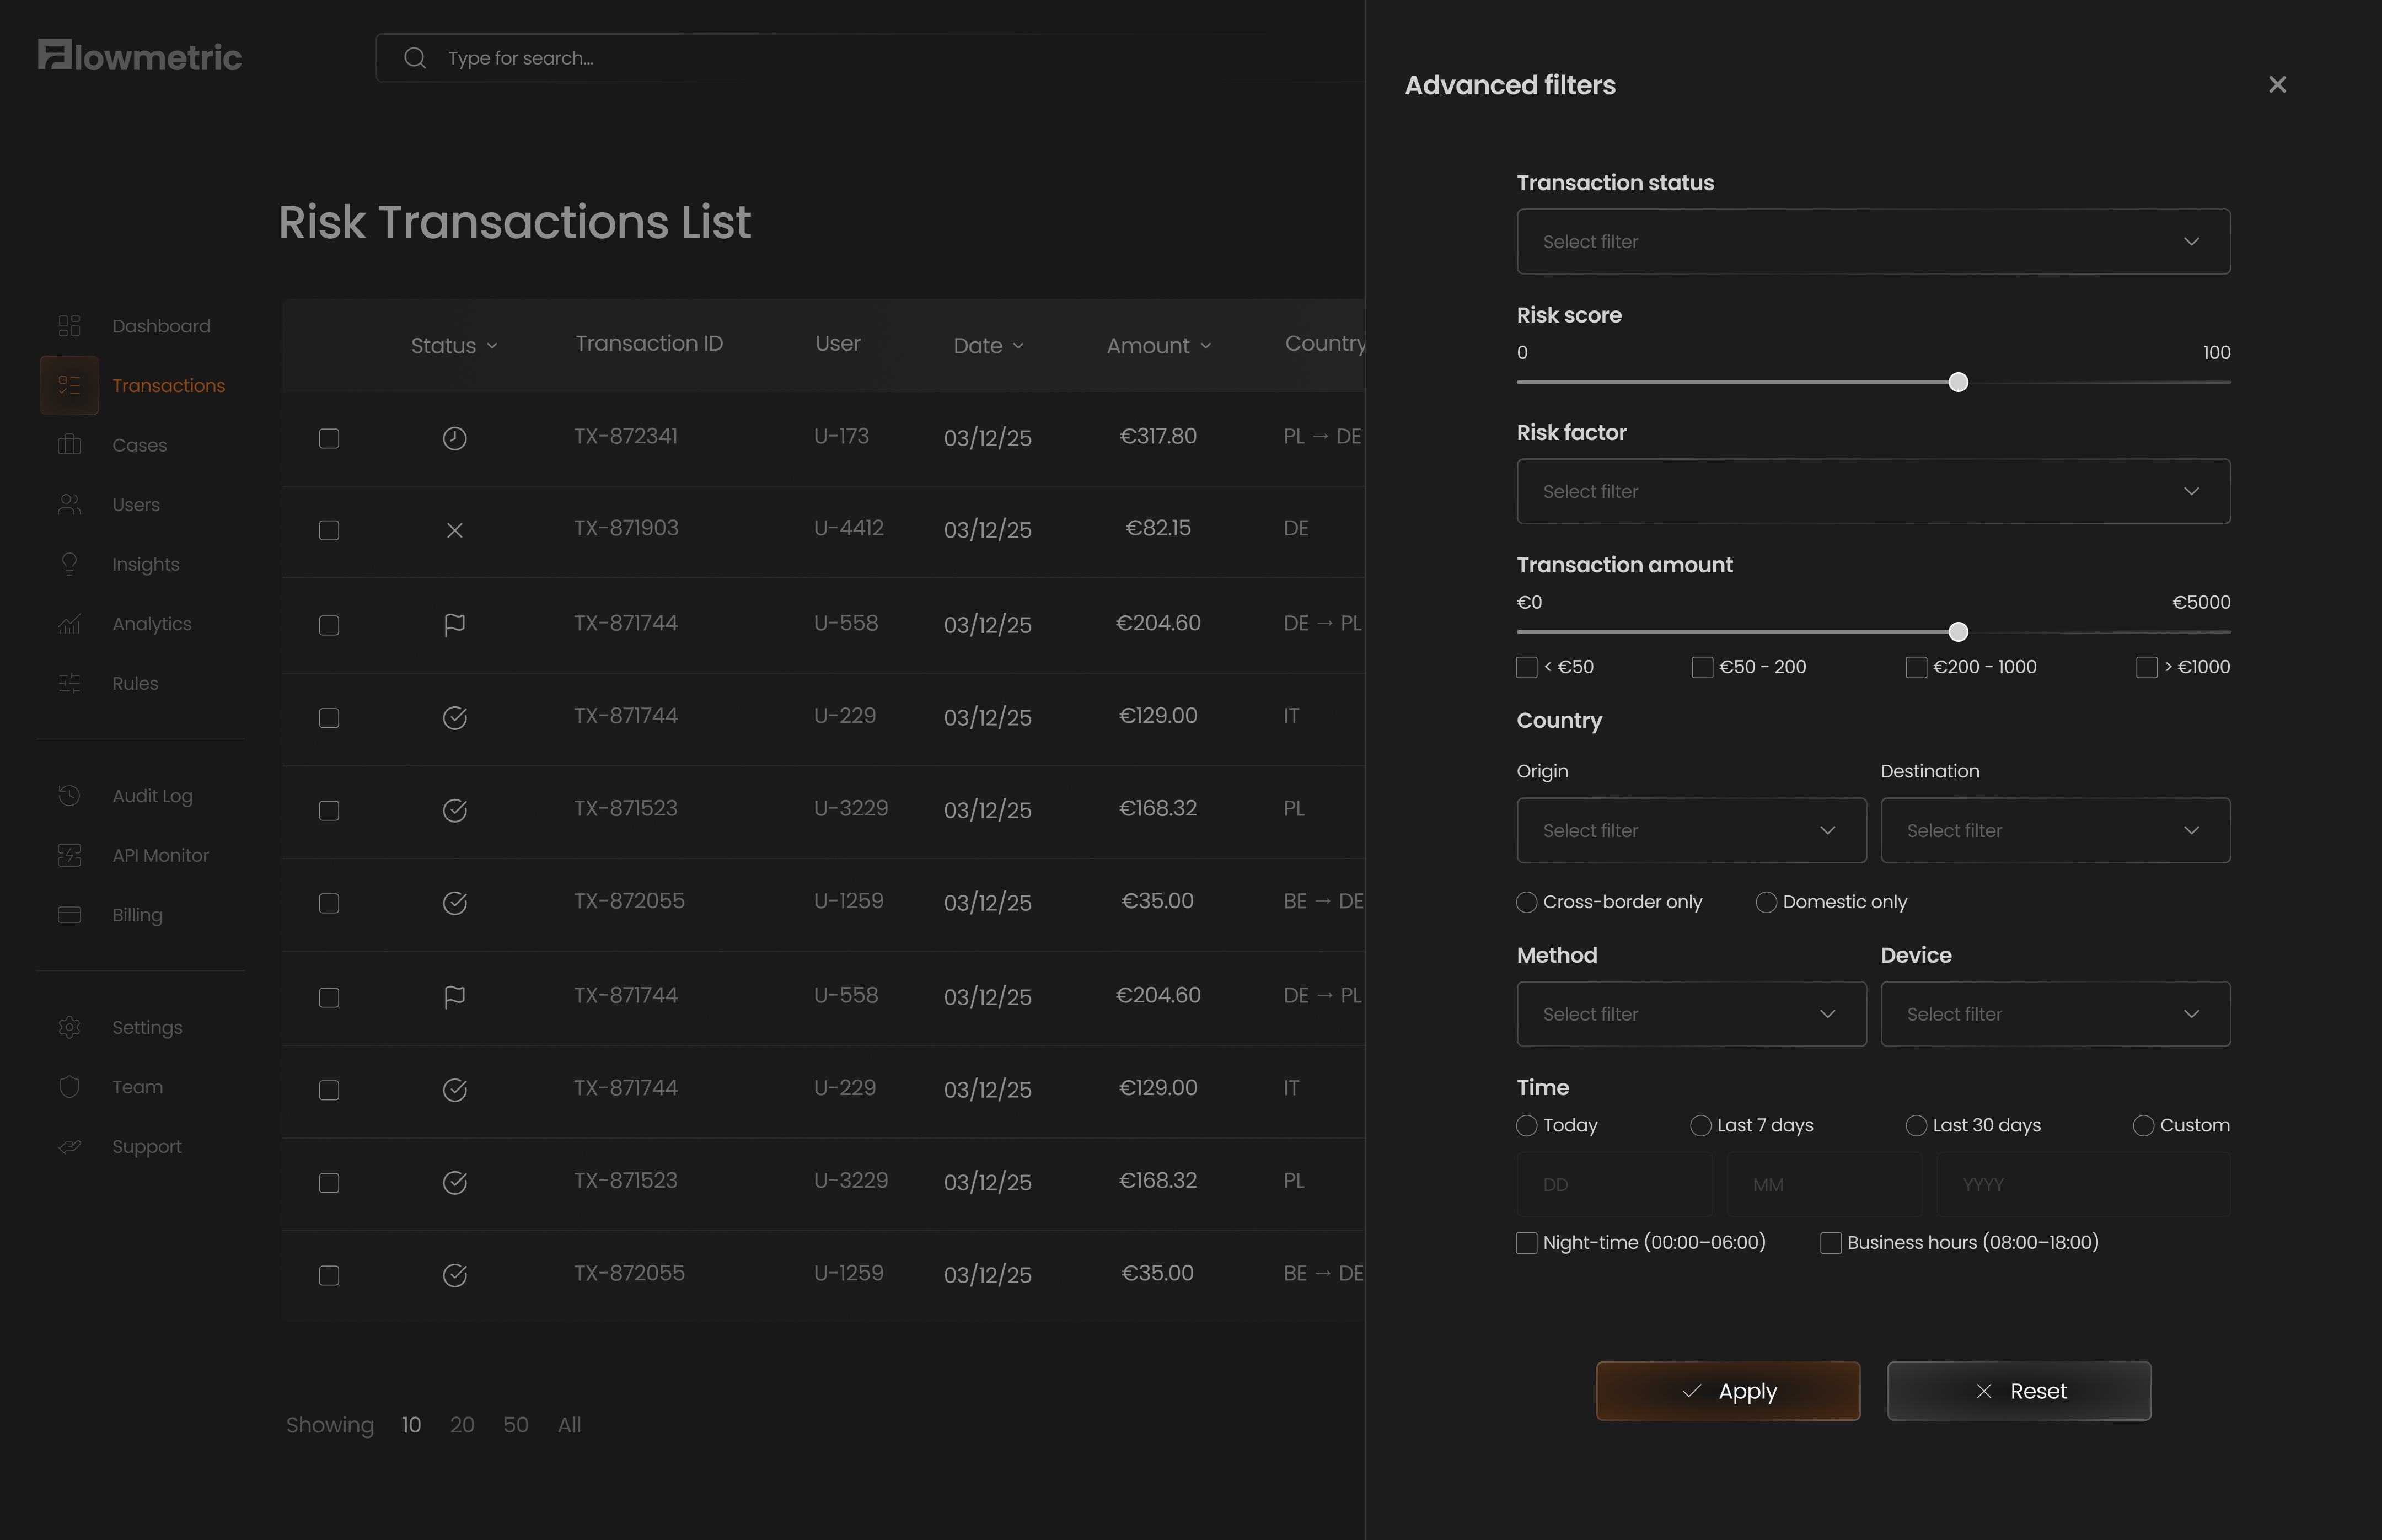
- Filters mirror real investigation patterns: risk-score range and factor, amount range with quick buckets, origin/destination countries with a cross-border toggle, method and device, and time windows with time-of-day presets.
- Where
- Advanced Filters
-
Added entity context to prevent single-event decisions
- Problem
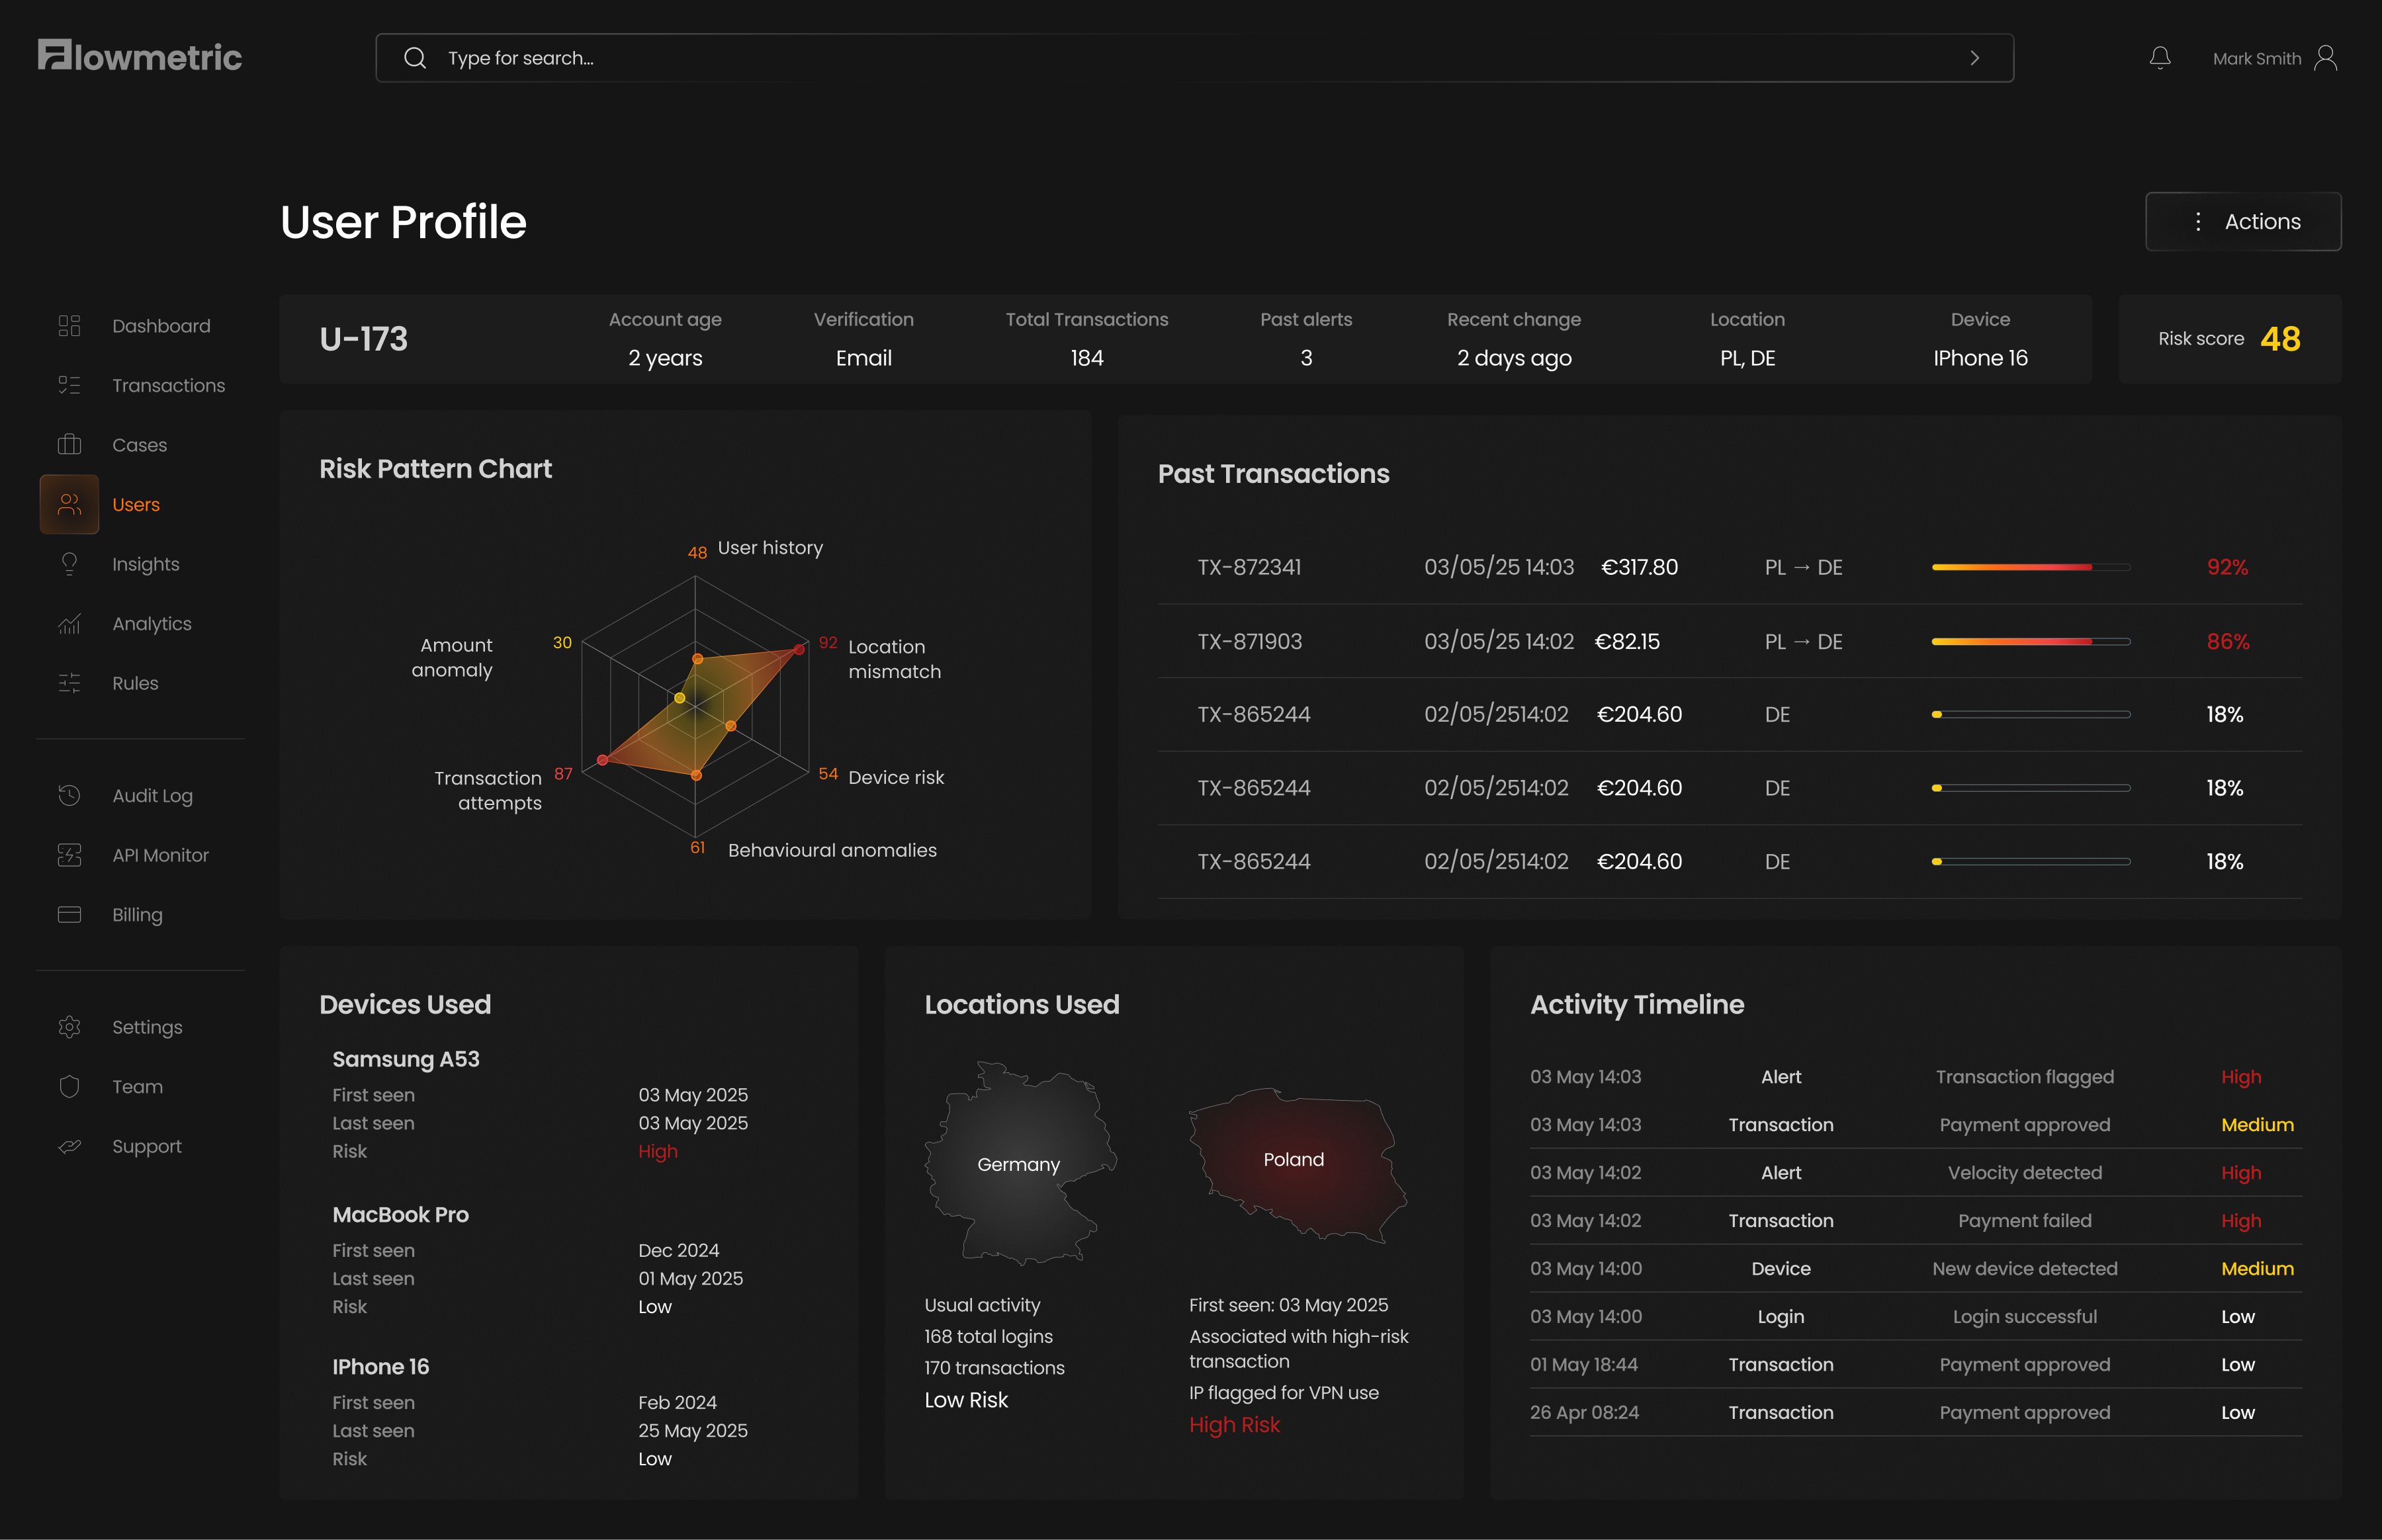
- A transaction can look suspicious without context.
- Decision
- A user profile surfaces account age, verification, past alerts, devices, and locations, plus risk-highlighted history and an activity timeline — so analysts can confirm pattern vs. anomaly.
- Where
- User Profile
-
Focused insights on concentration and change
- Problem
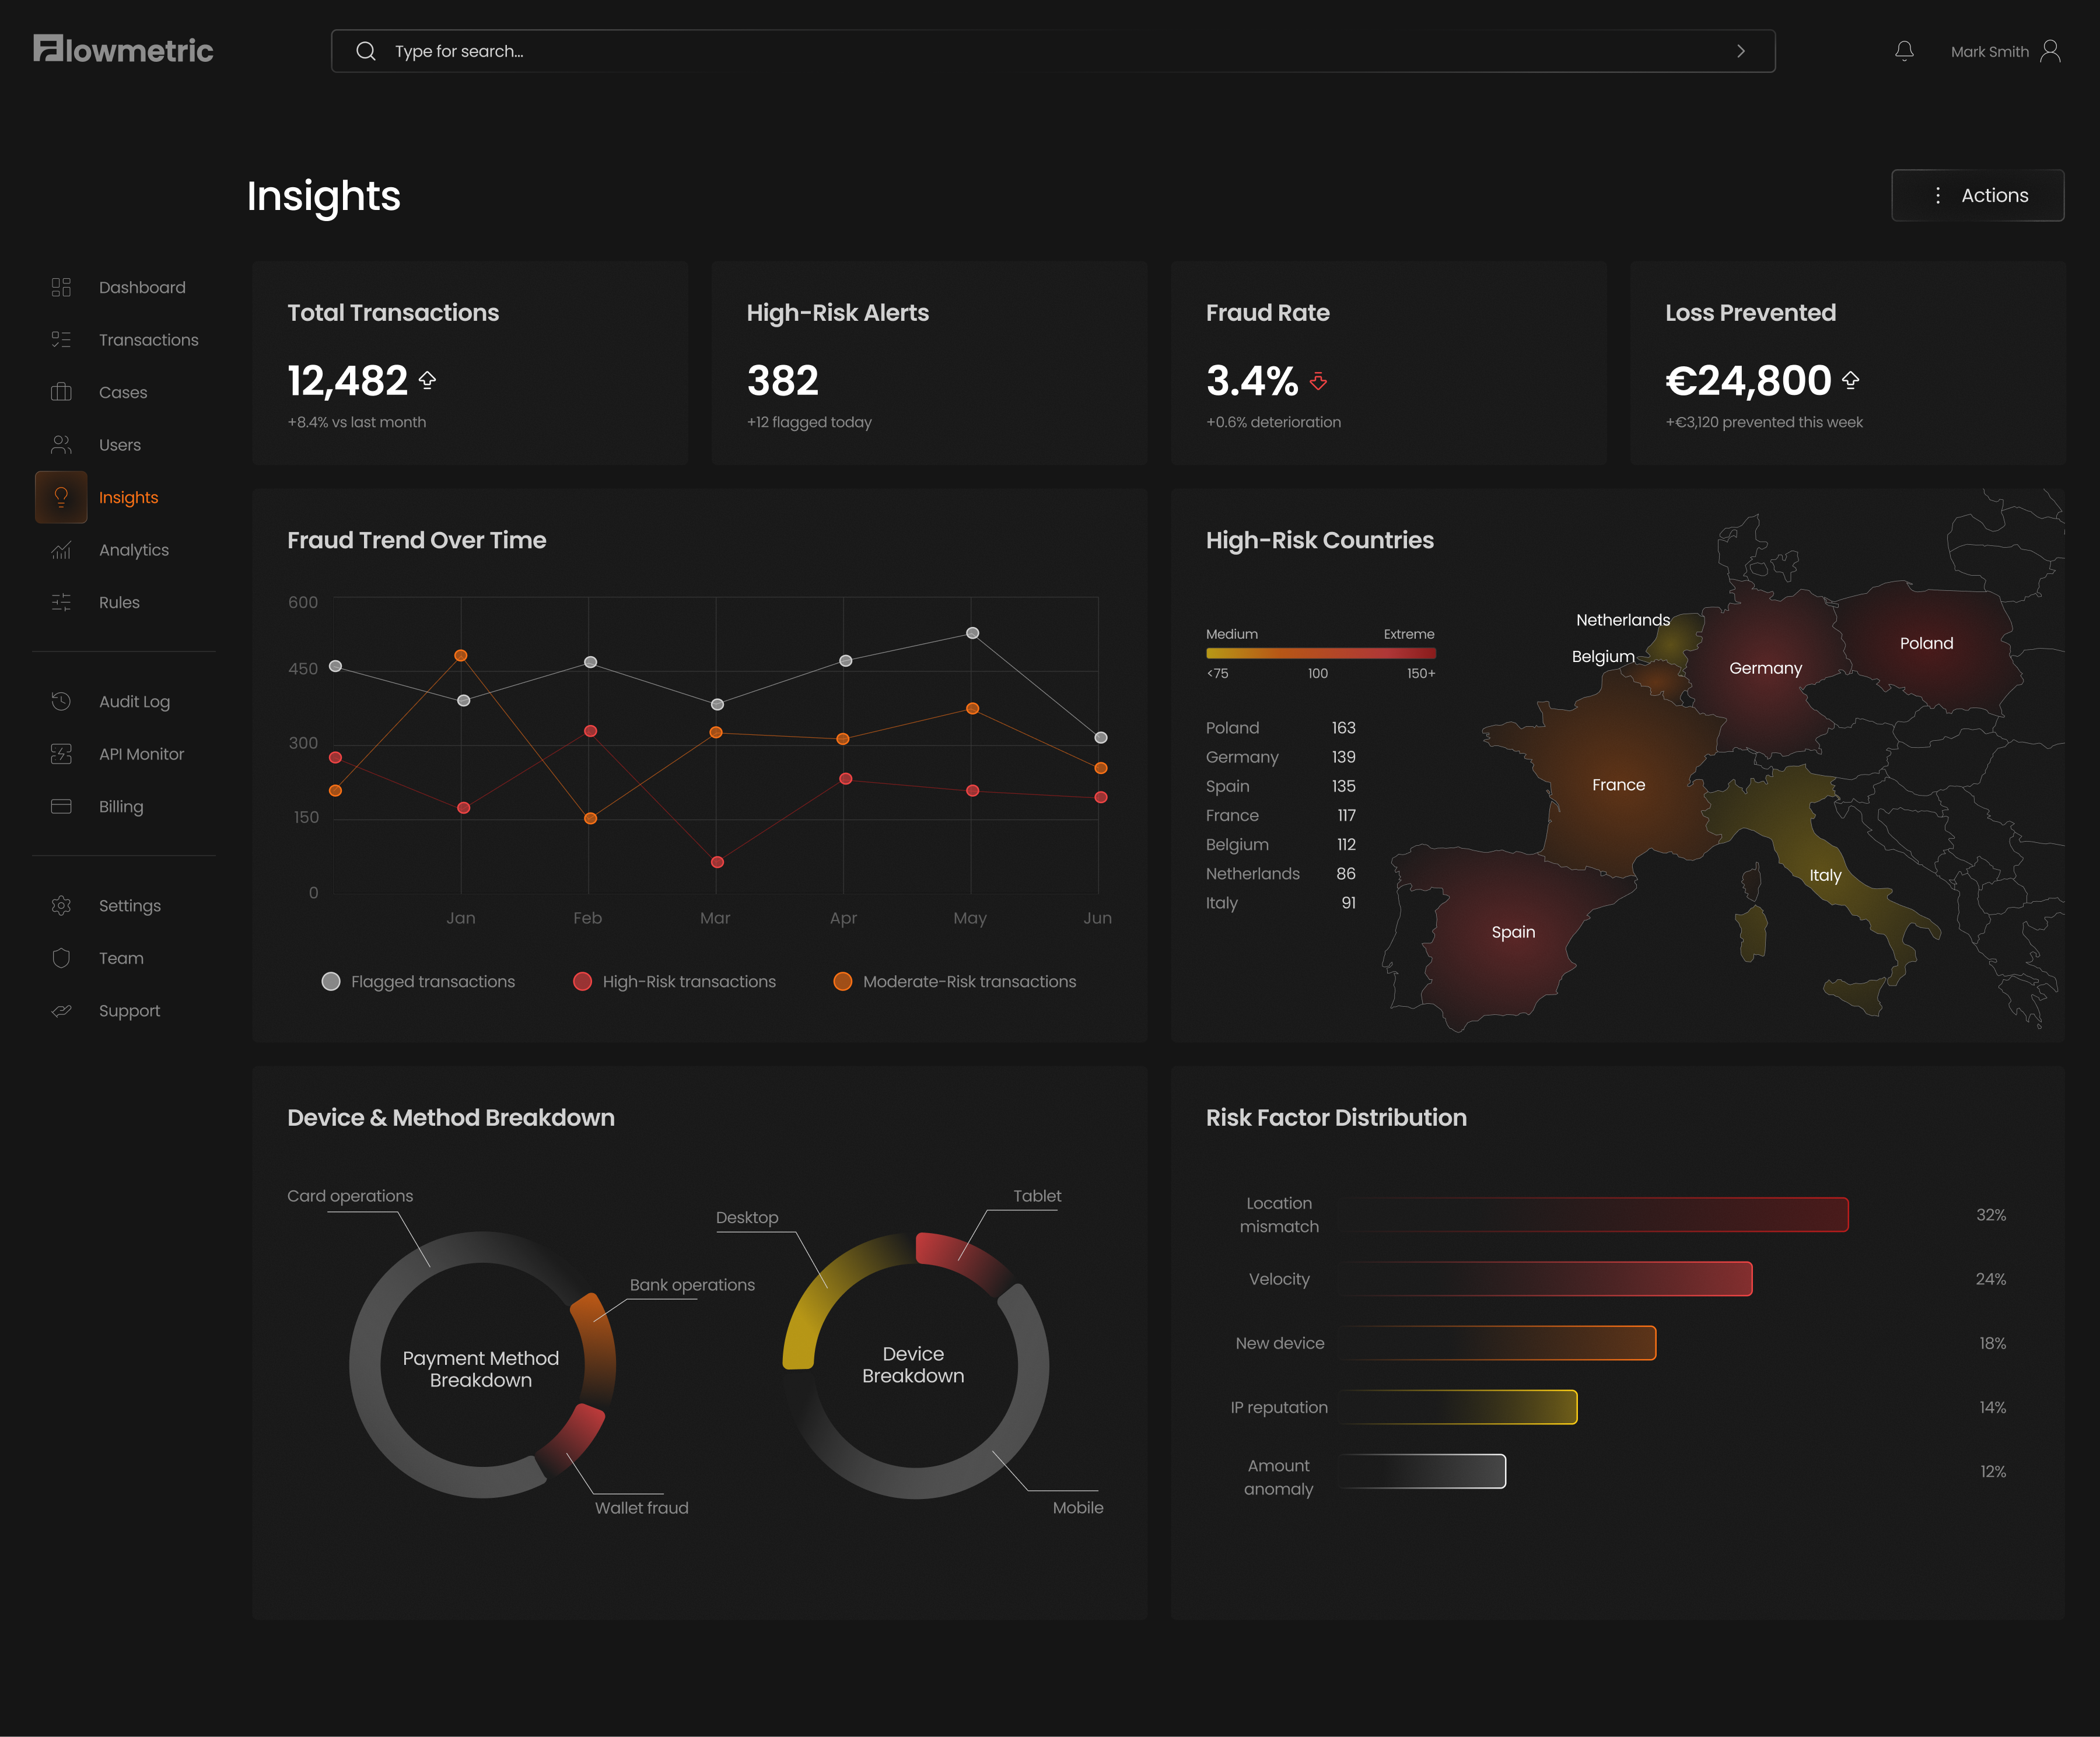
- Ops teams need early warning and tuning inputs, not just today's list.
- Decision
- Trends over time (flagged / high / moderate), a high-risk countries map and ranked list, risk-factor distribution, a device/method breakdown, and KPIs for fraud rate and loss prevented.
- Where
- Insights
Outcome
- A research-informed concept rather than a shipped product — but a self-contained one: the six screens work as a single system, carrying an analyst from a noisy queue to a defensible approve/decline without leaving the flow.
- A score-first model that keeps prioritization fast while making every high score explainable — the gap most fraud tools leave open.
- A consistent grammar across all six screens — one risk scale, one way of showing it, one table structure — that would extend cleanly to the next-step features below.
- The core UX bets are concrete enough to test: because the triage view claims “urgent work first” and the detail view claims “score, then proof,” those hierarchies can be validated with AI attention mapping before anything gets built.
Next Steps
- Validate the hierarchy. Run AI attention mapping over the dashboard and detail views to check the eye lands on the “needs attention” queue and the risk score first — the two claims the whole triage model rests on.
- Case management. Assignment, notes, escalation, and resolution states, so a flagged case has a lifecycle beyond approve/decline.
- Rules tuning view. Surface the triggered rules and thresholds per case, so ops can adjust detection from the evidence rather than in a separate tool.
- Bulk actions. For high-volume review during spikes.
- Expanded audit trail. A fuller, exportable history for compliance.
What I Took From It
The interesting problem in fraud tooling isn't detection — it's making a machine's verdict something a person can defend. Designing the evidence around the score, rather than after it, is what turns a ranked list into an investigation tool.
A score-first triage model that carries fraud analysts from a noisy queue to an evidence-based decision — and shows ops teams where risk is heading.
Self-initiated concept project.